via https://ift.tt/2ShcYIT
smallest-feeblest-boggart:
laura491:
tempest-caller:
bogleech:
fandomsandfeminism:
scottstrueself:
retasuneko:
stormingtheivory:
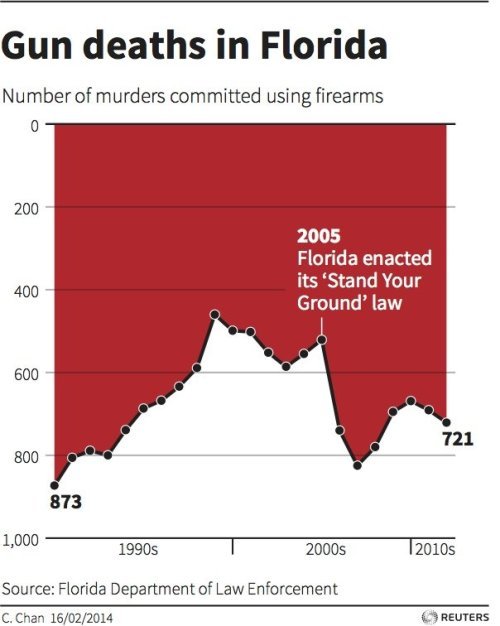
So can we talk about the absolutely stunning duplicity going on here?
…that’s cheating!
HOLY SHIT
That is some DELIBERATELY EVIL data representation. Where is the super villain that designed this fucking graph?
“Okay murders spiked by like well over 1000% but if we turn the graph THIS way, it’s like they went DOWN! HOORAYYYY!!!”
For anyone confused: the red represents the murder rate. Look at the numbers at the y axis. The graph is upside down because, normally, a graph starts at 0 and then goes up, but this one ends at 0.
As we put it in German: never trust statistics you haven’t manipulated yourself
this is fucking disgusting
I actually thought it was the right way around at first and thought it over for a while before thinking ‘aha! With the new law a lot of what would have been considered murders were justified by using ‘stand your ground’ laws, thus giving the illusion of gun murders going down but actually just reclassifying a lot of them as not murders!’
But no, they weren’t even that smart.
smallest-feeblest-boggart:
laura491:
tempest-caller:
bogleech:
fandomsandfeminism:
scottstrueself:
retasuneko:
stormingtheivory:
So can we talk about the absolutely stunning duplicity going on here?
…that’s cheating!
HOLY SHIT
That is some DELIBERATELY EVIL data representation. Where is the super villain that designed this fucking graph?
“Okay murders spiked by like well over 1000% but if we turn the graph THIS way, it’s like they went DOWN! HOORAYYYY!!!”
For anyone confused: the red represents the murder rate. Look at the numbers at the y axis. The graph is upside down because, normally, a graph starts at 0 and then goes up, but this one ends at 0.
As we put it in German: never trust statistics you haven’t manipulated yourself
this is fucking disgusting
I actually thought it was the right way around at first and thought it over for a while before thinking ‘aha! With the new law a lot of what would have been considered murders were justified by using ‘stand your ground’ laws, thus giving the illusion of gun murders going down but actually just reclassifying a lot of them as not murders!’
But no, they weren’t even that smart.